 |
MimIR
MimIR is my Intermediate Representation
|
|
MimIR
MimIR is my Intermediate Representation
|
Start here if you want to work on MimIR itself. This page is the contributor entry point for build, test, style, and debugging workflow. For API and IR usage patterns, continue with the Developer Guide.
If you do not have a GitHub account set up with SSH, you can clone MimIR via HTTPS instead:
For day-to-day development, a good default is:
Useful follow-up commands are:
The following CMake switches are available:
| CMake Switch | Options | Default | Comment |
|---|---|---|---|
| CMAKE_BUILD_TYPE | Debug | Release | RelWithDebInfo | Debug | Build type. |
| CMAKE_INSTALL_PREFIX | /usr/local | Install prefix. | |
| BUILD_SHARED_LIBS | ON | OFF | ON | If ON, build shared libraries. |
| MIM_BUILD_DOCS | ON | OFF | OFF | If ON, build the documentation (requires Doxygen). |
| MIM_BUILD_EXAMPLES | ON | OFF | OFF | If ON, build the examples. |
| MIM_BUILD_LL_RUNTIME | ON | OFF | ON | If ON, compile the ll backend's C runtime wrappers to LLVM IR (requires clang). |
| MIM_BUILD_PYTHON | ON | OFF | ON | If ON, build Python bindings. |
| MIM_CLANG | <path/to/clang> | autodetected | clang used to compile the ll backend's C runtime wrappers. |
| MIM_DEBUG_OPTIMIZE | ON | OFF | ON | If ON, compile Debug builds with -Og instead of -O0: same assertions and checks, but roughly 6x faster. Switch OFF when stepping through code, as -Og optimizes away some locals. |
| MIM_ENABLE_CHECKS | ON | OFF | ON | If ON, enable expensive runtime checks (requires CMAKE_BUILD_TYPE=Debug). |
| MIM_LLVM_LINK | <path/to/llvm-link> | autodetected | llvm-link used to link C runtime wrappers consisting of several files. |
| MIM_VER_SUFFIX | <suffix> | -dev | Suffix appended to the version string; use "" for a release. |
| MIM_VERIFY_PLUGINS | ON | OFF | ON | If ON, elaborate every plugin's .mim with its plugin library loaded after building it. --bootstrap alone never loads the libraries, so it cannot catch errors that need the normalizers. |
| BUILD_TESTING | ON | OFF | OFF | If ON, build all unit tests and lit tests. |
| MIM_FILECHECK | <filecheck_cmd> | autodetected | FileCheck command used by the lit tests. (requires BUILD_TESTING=ON). |
| MIM_LIT_TIMEOUT | <timeout_in_sec> | 120 | Timeout for lit tests. (requires BUILD_TESTING=ON). |
| MIM_LIT_WITH_VALGRIND | ON | OFF | OFF | If ON, run the Mim CLI in the lit tests under Valgrind. (requires BUILD_TESTING=ON). |
In addition to the provided submodules, you will need:
Mim emits LLVM IR, but it does not link against LLVM. So you can simply hand the emitted *.ll file to your system's LLVM toolchain. Strictly speaking, LLVM is not required unless you want to continue from emitted LLVM IR.
Run every in-tree test suite with:
Run the lit test suite with:
You can also invoke the lit tests manually and filter for a specific test:
If your build directory is actually called build, you can also use probe.sh:
test/ holds the doctest unit tests, built as mim-test and mim-regex-test. Run them - and every other CTest test - with:
You can additionally enable Valgrind via:
During debugging, you will usually want to run only a specific test case or subcase. Both filters accept * wildcards:
doctest breaks into an attached debugger on a failing assertion; pass -nb to suppress that.
Use the following coding conventions:
Use #include "..." for headers that belong to the artifact you are currently building and #include <...> for everything you link against - including external dependencies such as Abseil, fe, and the standard library.
The artifact a file belongs to - and hence the prefix of its own headers - follows from its path:
| Path | Artifact | Own headers |
|---|---|---|
| src/mim/..., include/mim/... | libmim | "mim/..." |
| src/automaton/..., include/automaton/... | libautomaton | "automaton/..." |
| src/mim/plug/X/..., include/mim/plug/X/... | plugin X | "mim/plug/X/..." |
| extra/X/... | out-of-tree plugin X | "mim/plug/X/..." |
| src/mim/cli/... | the mim CLI | - |
| test/... | the unit tests | - |
| py/bindings/... | the Python bindings | - |
The last three link against libmim but do not ship headers of their own, so they use <...> throughout. A plugin is a separate build artifact as well, so for a plugin X:
The generated autogen.h counts as part of the plugin, while another plugin's autogen.h does not.
The main upshot is that in-tree plugins in src/mim/plug/X and out-of-tree plugins in extra/X spell their includes in exactly the same way. Hence, scripts/extract_plugin.py can move a plugin out of the tree without touching a single #include, and an in-tree plugin exercises the same public header surface that an external plugin sees.
This is checked by scripts/check_includes.py, which is also wired up as a pre-commit hook:
For all the smaller details such as indentation width, use clang-format and the provided .clang-format file in the repository root.
To run clang-format automatically on changed files, install the provided pre-commit hook:
You can also disable clang-format for a piece of code when necessary. Depending on your editor, the Vim integration and similar plugins may also be useful.
Here is a small header that follows the conventions above:
This Vim plugin provides syntax highlighting for Mim files.
There is also a tree-sitter grammar for Mim files and a Helix fork with highlight and injection queries.
The Testing section above already provides some debugging tips. This section has more information about this topic.
See also:
You can directly invoke several MimIR dump helpers from within GDB, for example:
In particular, note the different output levels of mim::Def::dump.
You can also tweak the output behavior directly from within GDB by changing mim::World::flags or mim::World::log:
Another useful trick is to recover a Def* from a mim::Def::gid via mim::World::gid2def:
scripts/xdot.gdb provides custom GDB commands to generate a DOT graph and display it with xdot.
To enable it, source scripts/xdot.gdb from your ~/.gdbinit:
Here is the xdot GDB command in action:
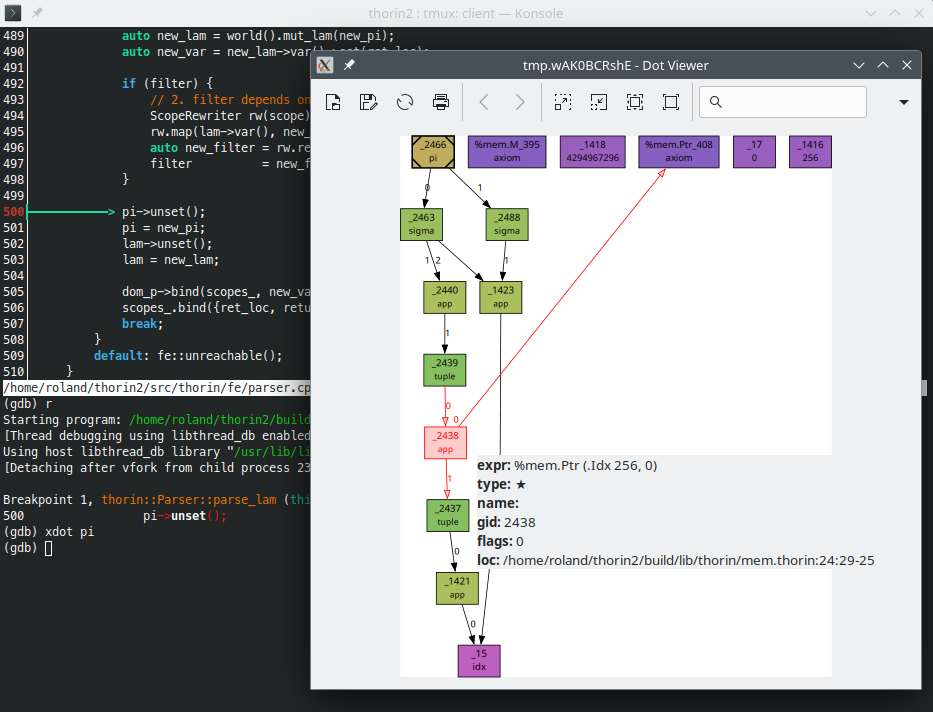
Often, you will want to inspect a specific mim::Def at a particular point in the program. Conditional breakpoints are very handy for this.
For example, the following command breaks if the mim::Def::gid of variable def is 42 at source location foo.cpp:23:
For several things, such as errors in the Mim frontend, MimIR uses C++ exceptions for error handling. To stop when an exception is thrown, use:
If you run into memory-related problems, it can be useful to run the program with Valgrind's GDB server.
Launch the test binary like this:
and then follow the instructions printed by Valgrind.
Each -V raises the log level by one; MimIR logs to stderr:
| Flag | fe::Log::Level |
|---|---|
| none | Error |
| -V | Warn |
| -VV | Info |
| -VVV | Verbose |
| -VVVV | Debug |
| -VVVVV | Trace |
Debug and Trace output only exists in a Debug build.
You can tell mim to trigger a breakpoint when certain events happen:
See the Command-Line Reference for the full list of flags.
If a compilation is taking longer than expected, use --profile to find out which mim::Phase is responsible. It measures wall-clock time spent in each phase and reports it via --output-profile <file> (or - for stdout) in one of three formats:
Once --profile has enabled profiling, --output-profile defaults to -; conversely, --output-profile <file> alone implies --profile trace. An unknown <mode> is an error.
The trace format dumps Chrome Trace Event Format JSON. Load the resulting file into chrome://tracing (see the official guide), into Perfetto, or into speedscope to inspect it as a timeline.
See fe::Profiler in the fe submodule for implementation details.
 1.18.0